ML MODEL MONITORING,
SIMPLIFIED
Confidence drops, data drifts, latency spikes—catch issues before users do. Purpose-built monitoring for ML inference, with real-time alerts and feature-level drift detection.
PURPOSE BUILT FOR ML PIPELINES

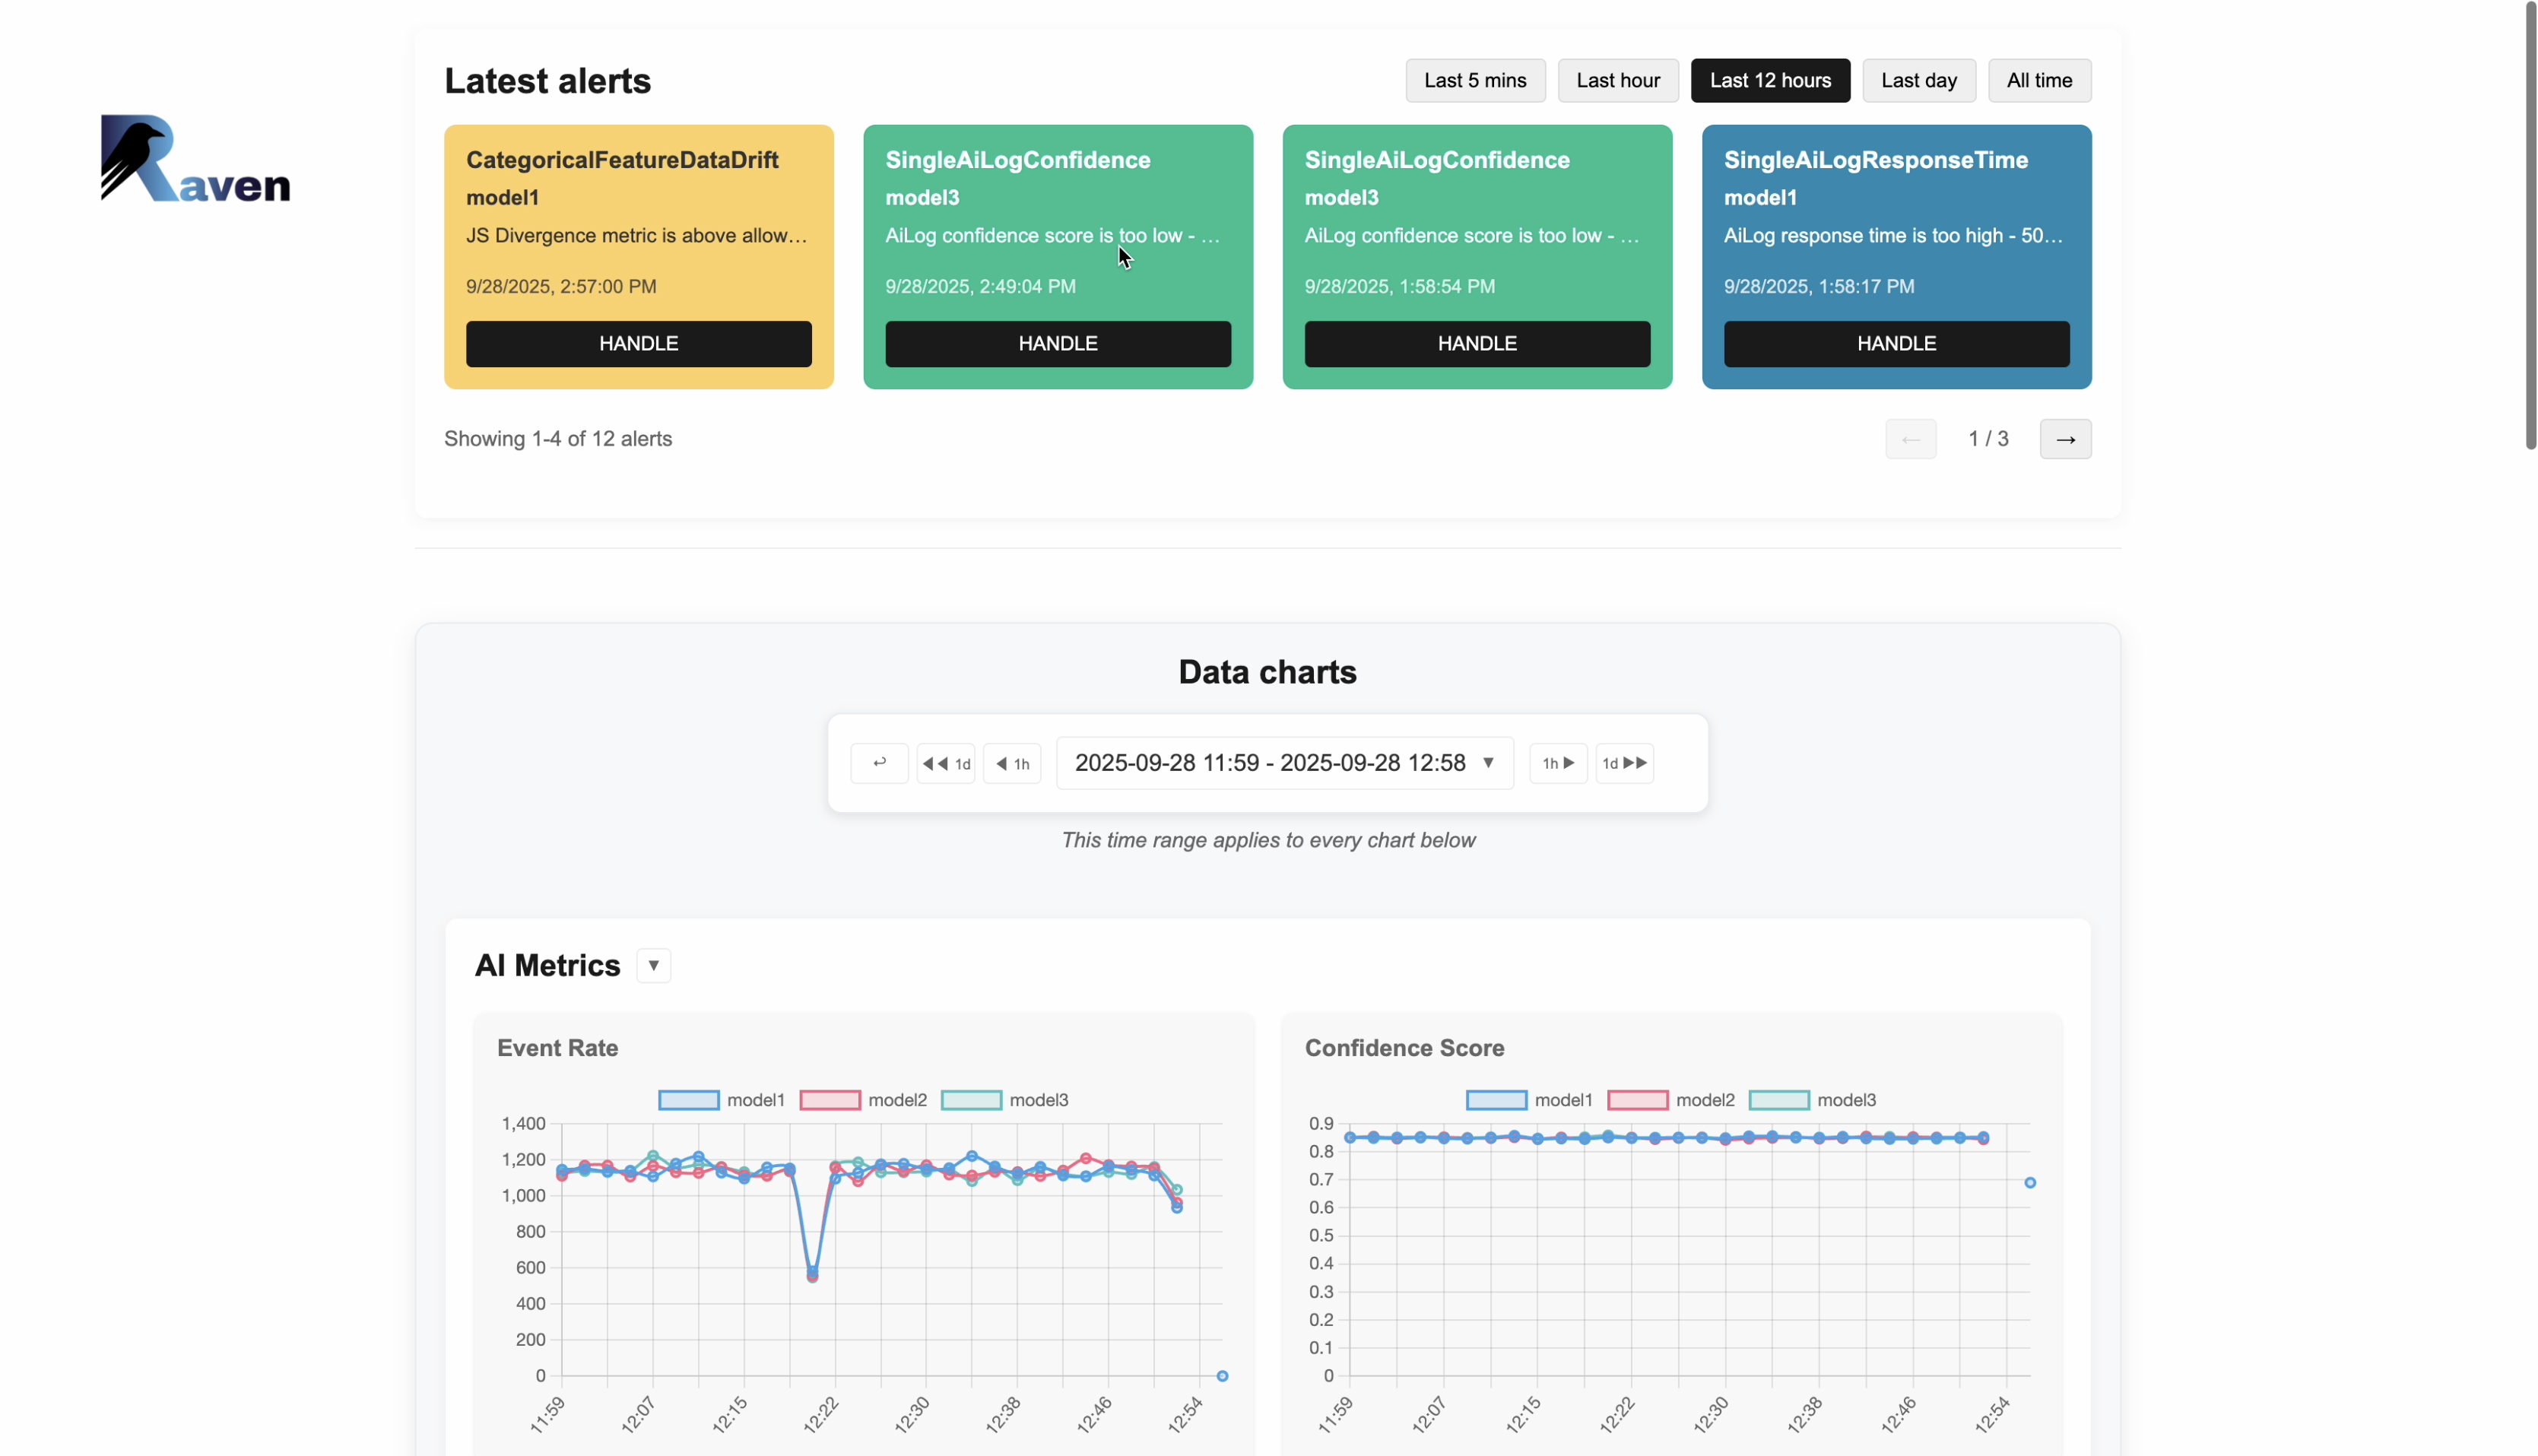
Real-time monitoring
Track confidence, latency, throughput, and output mix per model, per minute

Self-hosted
Helm chart, Kubernetes-ready. Your data never leaves your cluster

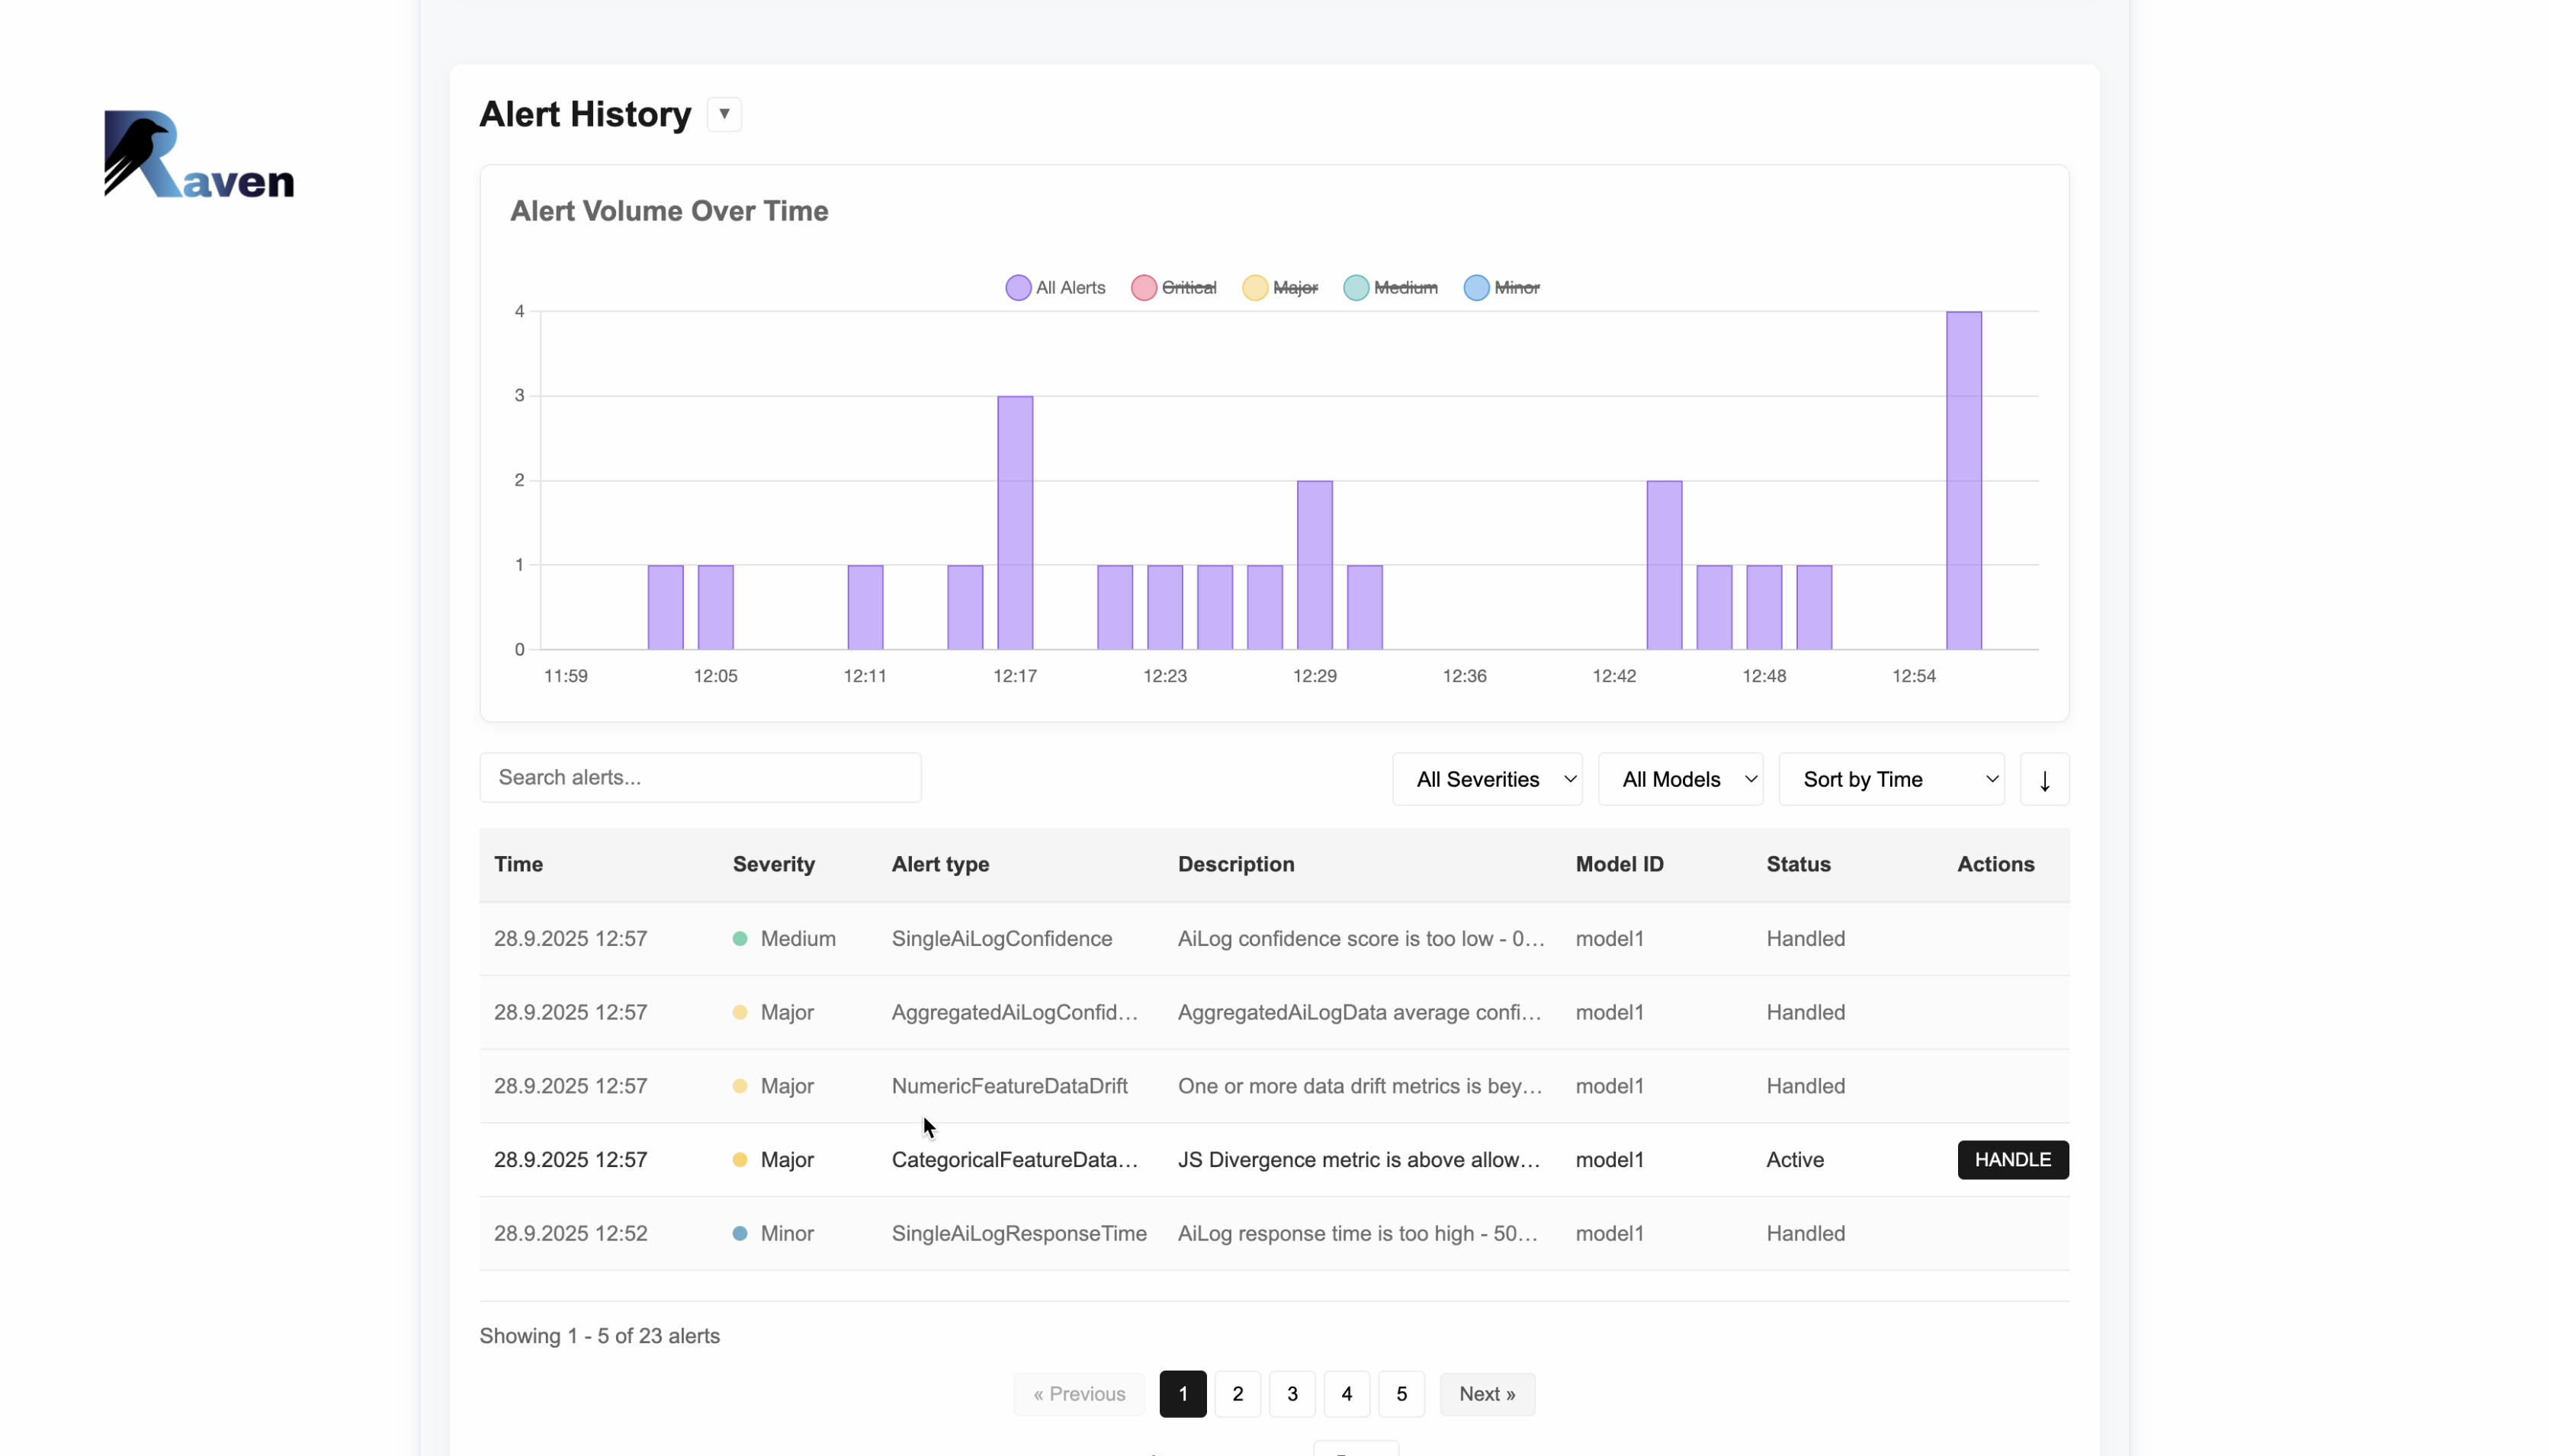
Drift detection
Automatically detect when your models start to drift from expected behavior

Alert notifications
Get instant alerts when issues are detected via Slack or email

Fast charts & history
ClickHouse-powered metrics, built for query speed and long retention

Dev-friendly SDKs
Minimal Python & JVM SDKs—drop-in log hooks in your inference code
FROM MODEL LOGS TO ALERT IN SECONDS
INTEGRATE
Add one line of code to start sending logs to Raven
MONITOR
Watch real-time dashboards update as requests come in
OPTIMIZE
Get alerted to issues and optimize based on insights
INSTALL IN MINUTES
Helm chart, simple config, SDK - you are ready to go
View DocumentationCHOOSE THE PLAN THAT BEST FITS YOUR NEEDS
Free / Test
Get familiar with the product
- Core metrics & dashboard
- HTTP ingest + ClickHouse
Drift detectionSlack/Email alerts
Pro
Production-ready, average-throughput
- Core metrics & dashboard
- HTTP ingest + ClickHouse
- Drift detection
- Slack/Email notifications
Enterprise
High throughput & scale
- Core metrics & dashboard
- HTTP ingest + ClickHouse
- Drift detection
- Slack/Email notifications
- Endless scalability
- High throughput